Stress test on Company Demo with Jmeter in Kubernetes Cluster
Background
Stress test is an effective way to evaluate the performance of web applications. Besides, more and more web applications are decomposed into several microservices and performance of each microservice may vary as some are compute intensive while some are IO intensive.
Stress test on web application based on microservice architecture plays a more important role. This blog will evaluate the performance of our company demo using JMeter 3.2(a powerful stress test tool) in Kubernetes cluster.
From the last post, we figured out the Manager service demands the most of the resources. Hence, in this plan, we will dig deeper into performance test on the Manager service.
Test Plan
Our JMeter test plan is:
-
Handle the authentication before stress tests as the authentication may introduce serious delay.
-
Keep visiting services in Company demo concurrently, push stress on the Manager services by QueryWorker, QueryBeekeeperDrone, QueryBeekeeperQueen HTTP request generator.
You can get the test plan from github.
  git clone https://github.com/ServiceComb/ServiceComb-Company-WorkShop
  cd ServiceComb-Company-WorkShop/stress-tests
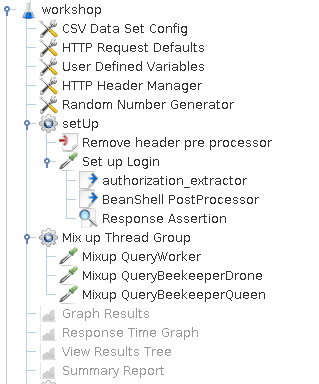 fig-1 JMeter test plan
At the very first of our test plan, we set up some global configurations that shared among all thread groups. The CSV Data Set Config loads our target server information from a local csv file. The HTTP Request Defaults sets up the default host and port in every request. The User Defined Variables defines variable that shared globally. The HTTP Header Manager adds headers define inside it to every request.
Then comes to the setUp thread group. It does the authentication job. The build-in way to authenticate in JMeter is the HTTP Cookie Manager as cookie is being used widely over web applications. However, our workshop demo uses the token based authentication instead of cookie based authentication. We need to take a detour to get authenticate done in JMeter. The Remove header pre processor uses the following script to avoid unnecessary headers being injected into login requests.
import org.apache.jmeter.protocol.http.control.Header;
sampler.getHeaderManager().removeHeaderNamed("Authorization");
Then we retrieve login credential in the Set up Login request. The authorization_extractor is a Regular Expression Extractor used to extract the value of Authorization header. As variables can not pass from one thread group to another, it need to convert to the global property and the script in BeanShell PostProcessor does the job.
${__setProperty(Authorization,${Authorization},)}
The last part of our test plan is the stress tests perform on our services. We test three endpoints as they all pass from the manager service to the other two microservices, namely worker and beekeeper. Before we test, we disable the caching capability by enabling StressTest profile in manager so that the worker service and beekeeper service can serve the incoming computing task all the time. Besides, we simplify the computing task by setting the request argument to be just 1.
Test Steps
-
Start the Company demo in the Kubernetes cluster without resource limits.
-
Replace the content of hosts.csv file with the IP address and port of the Company demo running in the Kubernetes cluster. The content in hosts.csv is:
127.0.0.1,8083 -
Run the tests. Using 200 threads to generate requests concurrently, and set the duration to be 600 seconds.
jmeter -n -t workshop.jmx -j workshop.log -l workshop.jtl -Jthreads=200 -Jduration=600
Test Results
The performance among various concurrency is as follows:
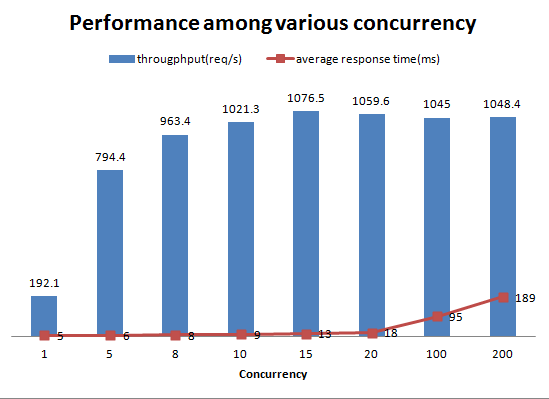 fig-2 Performance among various concurrency
fig-2 shows that performance of manager service remained stable until it reached the bottleneck(at concurrency of 15), it speeds up to about 1000 requests per seconds while keeping the average response time low. Later on, as the concurrency increased, the average response time increased dramatically. The response time statistics can be helpful when evaluating the circuit-break timeout settings.
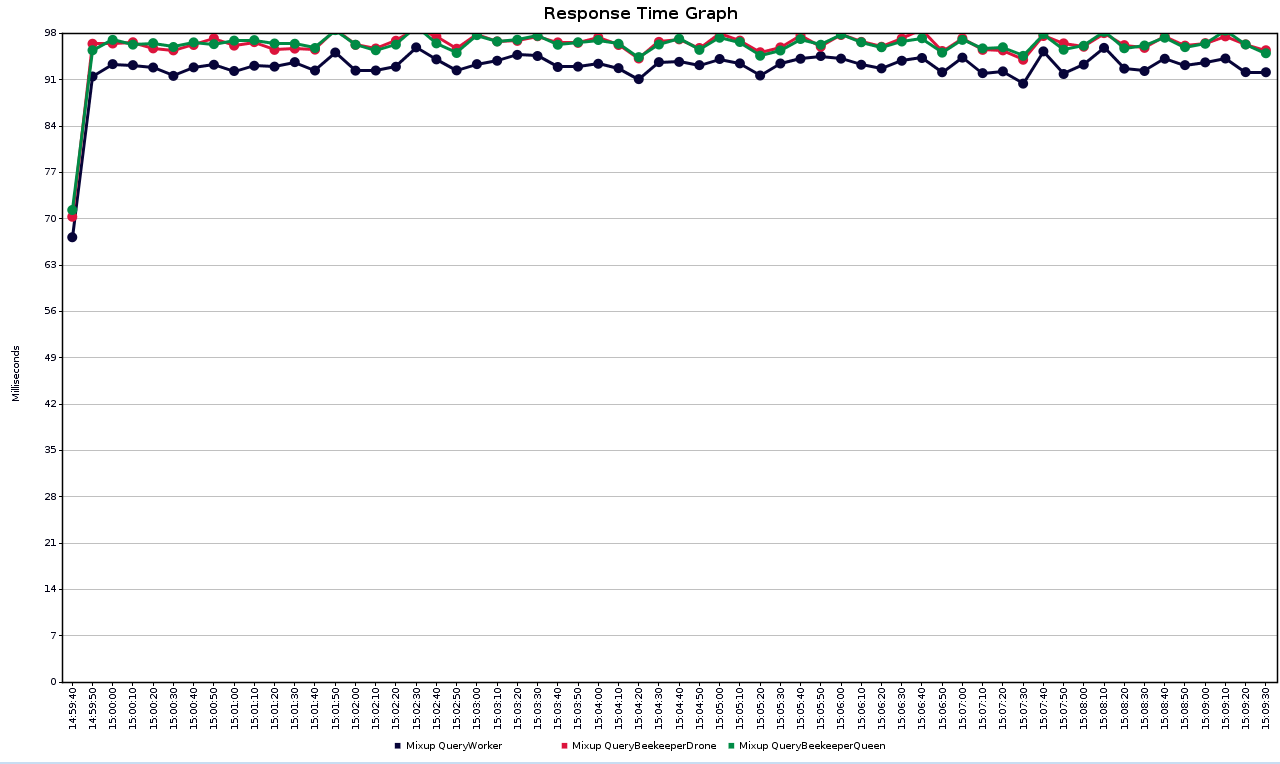 fig-3 Average response time among different services
fig-3 shows the average response time of different services. As the beekeeper service relies on the worker service, it had a longer response time than the worker service.
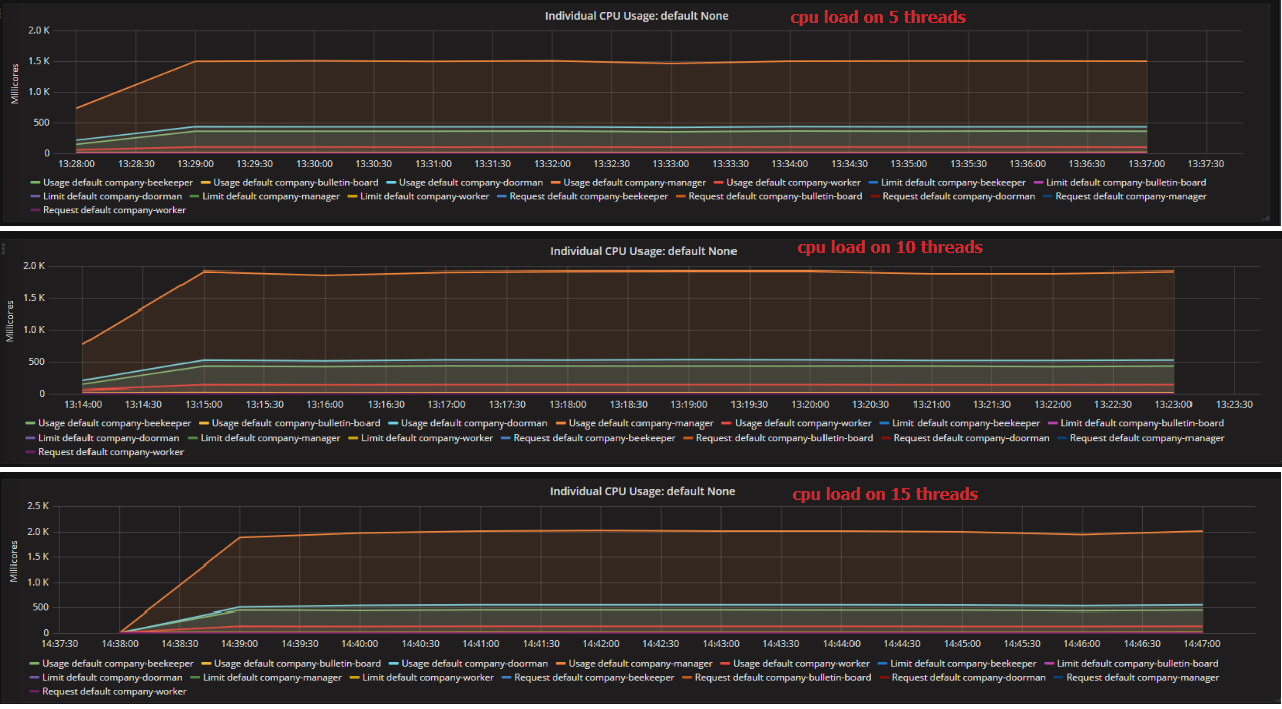 fig-4 CPU Load on various concurrency
To find out why the performance stuck at the concurrency of 15, we checked the monitor data from Heapster as fig-4 shows. Apparently, manager service became the bottleneck of the whole system. It reached the maximum cpu load when the throughput was around 1000 req/s. Other services increased much slower than manager service and required less resources.
As manager service logs directly to the stdout and the JMeter test client running on a single host may not simulate enough concurrency simultaneously. As such, we tested on different scenes of log settings(log4j1 stdout, log4j2 stdout, log4j2 asynchronous, none) at the concurrency of 200. The asynchronous log settings in log4j2.xml file is as follows:
<?xml version="1.0" encoding="UTF-8" ?>
<Configuration status="INFO">
  <Appenders>
    <RandomAccessFile name="RandomAccessFile" fileName="manager.log" immediateFlush="false" append="false">
      <PatternLayout pattern="%d [%p] %m %l%n"/>
    </RandomAccessFile>
  </Appenders>
  <Loggers>
    <asyncRoot level="info">
      <AppenderRef ref="RandomAccessFile"/>
    </asyncRoot>
  </Loggers>
</Configuration>
Besides, we also need to add the disruptor dependency to enable the asynchronous log settings.
<dependency>
  <groupId>com.lmax</groupId>
  <artifactId>disruptor</artifactId>
  <version>3.3.6</version>
</dependency>
The none log settings just replace the info logging level to off in the above setting. We also tested on distributed JMeter test client environment. Running Jmeter in distributed mode takes two steps:
-
run JMeter slave on each test node, the command is as follows:
jmeter-server -Djava.rmi.server.hostname=$(ifconfig eth0 | grep "inet addr" | awk '{print $2}' | cut -d ":" -f2) -
run JMeter master, the command is as follows:
jmeter -n -R host1,host2 -t workshop.jmx -j workshop.log -l workshop.jtl -Gmin=1 -Gmax=2 -Gthreads=200 -Gduration=600Note: JMeter property does not work in distributed mode. It needs to be declared as a global property. That’s why We use -G option here instead of -J option.
The results are as follows:
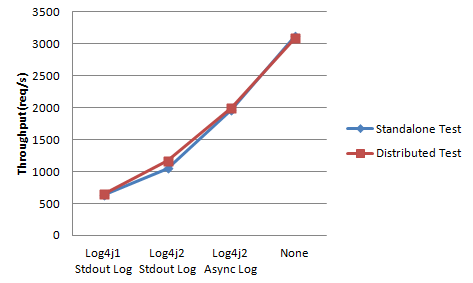 From the above figure, we can conclude that:
-
The performance in JMeter distributed mode and single mode are so close, it seems that a single JMeter test client is able to simulate enough concurrency for the current test.
-
The log takes up too many computing resources when directly output to stdout and the asynchronous way has improved nearly 100% throughput of the original. Seems like using the synchronous log settings may not be wise in production environment.
-
The log4j2 has improved about 40% throughput of the log4j1 and reduced a small amount of memory. Hence, it’s recommended to replace the log4j1 with log4j2 for the sake of performance.
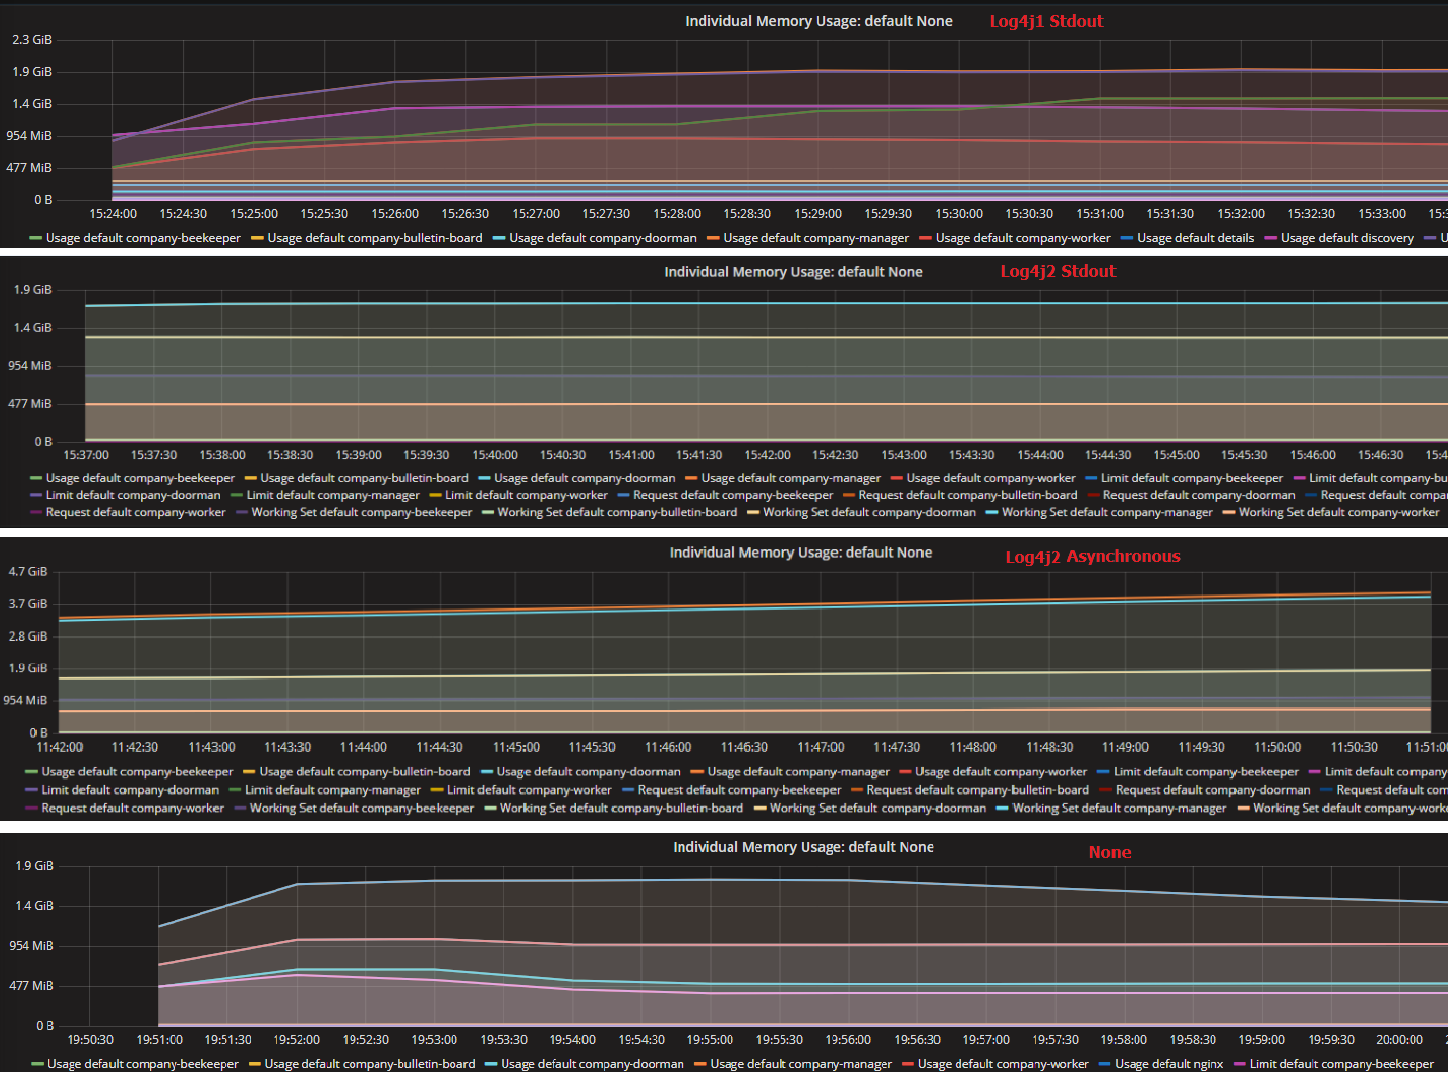 fig-5 memory usage of different log settings
Although the asynchronous way save us much computing resources, it takes up a great deal of memory in the meanwhile as fig-5 shows.
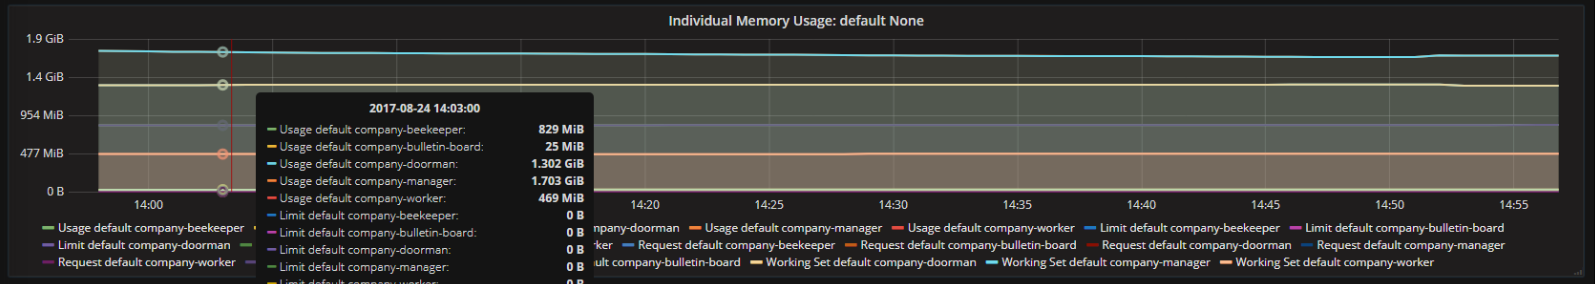 fig-6 Memory Usage of different services
fig-6 shows the memory usage of different services during tests. As company demo is a simple use case, the memory usage remained quite stable during tests. Comparing to memory usage of the bulletin board service(written in go), other services written in Java take a great deal of memory.
Conclusions
Stress test on applications can help us find out the potential problems in our services before our services run in production environment. It simulates the production environment and validates whether our services meet the specification requirements. We can tune our pod deployment settings based on the stress test result to system’s maximum throughput while keeping SLA.
Applications based on microservice architecture become much more flexible not only on design, programming and tests, but also on deployment. Services based on microservice architecture make resources scale up and down extremely fast. We can choose different specifications of machine and different replicas for different services according to the maximum throughput to save resources. Besides, the scalability of cloud makes services handle visit storm easily.
Leave a Comment
Your email address will not be published. Required fields are marked *