Metrics in 1.0.0-m1
Metrics had supported from Java chassis version 0.5.0,in version 1.0.0-m1,we had reconstruction it and add some more features,please checkout the user guide and release note for more information.Also subscribe ServiceComb mail-list(dev-subscribe@servicecomb.apache.org) and join discussion is welcome.
Background
Microservice is trend of technology,it resolve many problems also follows new problem.
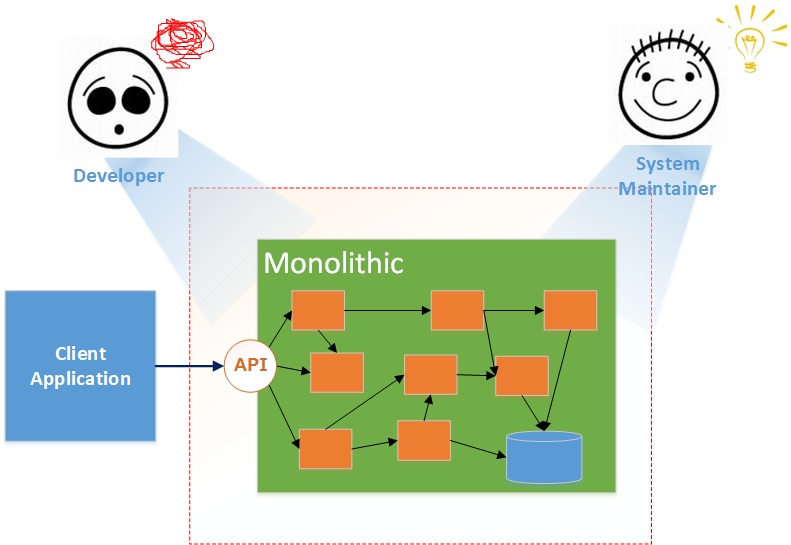
This is traditional software architecture always called ‘Monolithic’,it’s difficult for developer maintain the code or add new feature because of tight coupling,but it’s easy for operation engineer deploy and maintenance(only one system process).
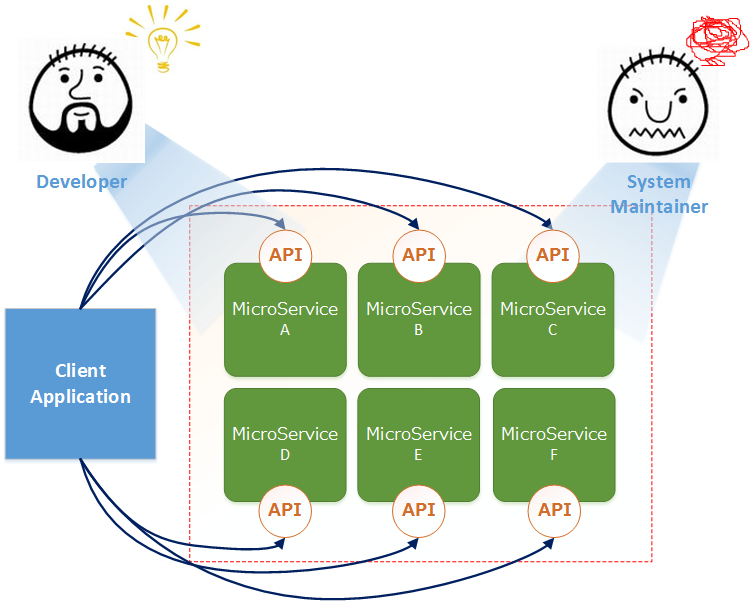
This is microservice system architecture,after split ‘Monolithic’ into many small services,developer obtain many benefits such as architecture independent and more agility etc,but operation engineer need to maintenance a whole lot of microservice instances.If don’t import metrics,when system is abnormal or user experience getting worse,it’s very difficult to dentifying where the problem is and make some strategy in order to prevent it.
1.0.00-m1 Principles
In previous version(0.5.0),implementation of metrics had some imperfections:
- Metrics code written in foundation-metrics module,it’s a low level module,and include some customized function;
- Use ThreadLocal variable collect and statistics data,performance hight but has memory leak risk;
- Output data of metrics is joined text not dependent number,difficult to reuse;
- Not support publish,unable integration with other monitor system;
- Because foundation-metrics is a low level module and certainly be loaded,user can’t exclude it if unnecessary.
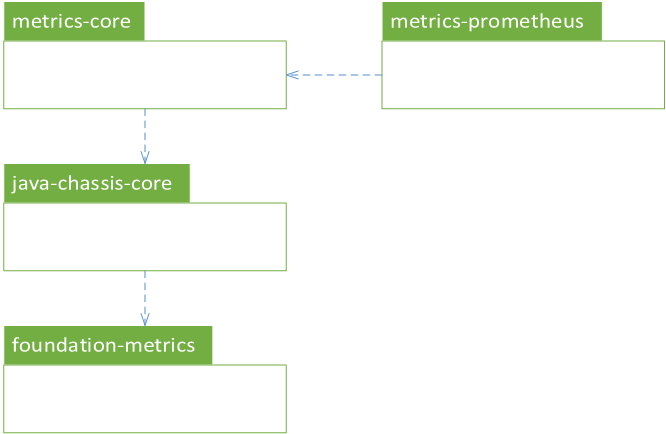
So,upgrading from 0.5.0 to 1.0.0-m1,we had done a fully reconstruction,now it’s include this modules:
| Module Name | Description |
|---|---|
| foundation-metrics | Metrics mechanism module |
| metrics-core | Metrics core module,work immediately after imported |
| metrics-integration | Include metrics Integration with other monitor system |
The dependency of this modules is:
Use event collect invocation data,not from Hystrix(handler-bizkeeper)any more
From 1.0.0-m1 invocation data such as TPS and latency are collected from invocation event,not from Hystrix(handler-bizkeeper) any more,so you don’t need add Java Chassis Bizkeeper Handler only for metrics.we use EventBus in foundation-common,when EventBus had initialized,three build-in event listener class will be auto registered via SPI(Service Provider Interface):
| Event Listener Name | Description |
|---|---|
| InvocationStartedEventListener | Process InvocationStartedEvent when consumer or producer called |
| InvocationStartExecutionEventListener | Process InvocationStartExecutionEvent when producer fetch invocation from queue and start process |
| InvocationFinishedEventListener | Process InvocationFinishedEvent when consumer call returned or producer process finished |
ServiceComb java chassis had used Vertx as Reactor framework,in synchronous call mode when producer received invocation from consumer,it won’t start process immediately but put it into a queue,this queue called invocation queue(like disk queue in operation system),time waiting in the queue called LifeTimeInQueue,the length of the queue called waitInQueue,this two metrics are very important for measure stress of the microservice;consumer not has this queue,so InvocationStartProcessingEvent will never be triggered at consumer side.
The code for trigger event write in RestInvocation,HighwayServerInvoke and InvokerUtils,if microservice don’t import metrics,event listeners of metrics won’t be registered,the impact on performance is little.
Use Netflix Servo as Monitor of Metric
Netflix Servo had implement a collection of high performance monitor,we had used five of them:
| Monitor Name | Description |
|---|---|
| BasicCounter | As name of it,always increment |
| StepCounter | Called ‘ResettableCounter’ before |
| BasicTimer | Time (Latency) monitor |
| BasicGauge | Return a Callable call result monitor |
| MaxGauge | Mark max value in step |
The version of Servo we used is 0.10.1
Window Time(also may called ‘Polling Interval’ or ‘Step Cycle’)
Metrics had many classifications,we can divided them into two major types by how get value:
- Direct get
You can direct get newest value anytime,such as system resource usage include cpu load rate,running thread count,heap size and call count,queue length,etc. - From statistics
After a ‘certain time’ passed can counting the value,this time we called ‘Window Time’,include:
a) Take one from many,like Max、Min、Median;
b) Time-related,like TPS(transaction per second);
c) Count-related,like average,variance.
If get value of this type,the result returned is the last ‘Step Cycle’ counted.in Servo,this time called ‘Polling Intervals’. From 1.0.0-m1,can set servicecomb.metrics.window_time in microservice.yaml,it has same effect as set servo.pollers.
Notice: Servo had marked with DEPRECATED by Netflix, we will use Netflix spectator instead in 1.0.0-m2, no need to set the window_time any more
Metrics ID Format
From 1.0.0-m1,build-in two type Metric output:
JVM Information
ID format is : jvm(statistic=gauge,name={name}) name include:
| Name | Description |
|---|---|
| cpuLoad | CPU load rate |
| cpuRunningThreads | Running thread count |
| heapInit,heapMax,heapCommit,heapUsed | Memory heap usage |
| nonHeapInit,nonHeapMax,nonHeapCommit,nonHeapUsed | Memory nonHeap usage |
Invocation Information
ID format is : servicecomb.invocation(operation={operationName},role={role},stage={stage},statistic={statistic},status={status},unit={unit}) Tag name and value below:
| Tag Name | Description | Options or Values |
|---|---|---|
| operationName | Operation full name | MicroserviceQualifiedName |
| role | Consumer side or Producer side | consume,producer |
| stage | Stage of metrics | queue(producer only),execution(producer only,total |
| statistic | Normally metric type | tps,count(total call count),max,waitInQueue(producer),latency |
| status | Call result code | 200, 404 etc.. |
| unit | TimeUint of latency | MILLISECONDS,SECONDS etc.. |
How to Configuration
Global Configuration
Please add window time config in microservice.yaml:
APPLICATION_ID: demo
service_description:
  name: demoService
  version: 0.0.1

servicecomb:
  metrics:
    #window time,same as servo.pollers,unit is millisecond,default value is 5000 (5 seconds)
    window_time: 5000
In order to decrease difficulty for understand and usage of metrics,we temporary do not support multi window time
Maven Configuration
We just only need add metrics-core dependency:
    <dependency>
      <groupId>org.apache.servicecomb</groupId>
      <artifactId>metrics-core</artifactId>
      <version>1.0.0-m1</version>
    </dependency>
How to Get Metrics Data
After configuration completed,you can get collected metrics data via this two method:
Embedded publish interface
When microservice start-up,metrics-core will auto publish data service using Springmvc provider:
@RestSchema(schemaId = "metricsEndpoint")
@RequestMapping(path = "/metrics")
public class MetricsPublisher {
  @ApiResponses({
      @ApiResponse(code = 400, response = String.class, message = "illegal request content"),
  })
  @RequestMapping(path = "/", method = RequestMethod.GET)
  @CrossOrigin
  public Map<String, Double> measure() {
    return MonitorManager.getInstance().measure();
  }
}
So,if you had config rest provider in microservice.yaml,like:
servicecomb:
  service:
    registry:
      address: http://127.0.0.1:30100
  rest:
    address: 0.0.0.0:8080
You can open a browser and input http://localhost:8080/metrics direct get metrics data.
Direct programming get
From above code you can known,the entry of data provider is org.apache.servicecomb.metrics.core.MonitorManager,so if you want develop your own metrics publisher,direct get it is enough.
MonitorManager manager = MonitorManager.getInstance();
Map<String, Double> metrics = manager.measure();
Notice: Servo had marked with DEPRECATED by Netflix, we will use Netflix spectator instead in 1.0.0-m2, publish interface will be adjusted
How to Use Metrics Data
Metrics data will output as Map<String,Double>,in order to let user easier fetch certain metric value,we provide org.apache.servicecomb.foundation.metrics.publish.MetricsLoader tool class:
    //simulate MonitorManager.getInstance().measure() get all metrics data
    Map<String, Double> metrics = new HashMap<>();
    metrics.put("X(K1=1,K2=2,K3=3)", 100.0);
    metrics.put("X(K1=1,K2=20,K3=30)", 200.0);
    metrics.put("X(K1=2,K2=200,K3=300)", 300.0);
    metrics.put("X(K1=2,K2=2000,K3=3000)", 400.0);

    metrics.put("Y(K1=1,K2=2,K3=3)", 500.0);
    metrics.put("Y(K1=10,K2=20,K3=30)", 600.0);
    metrics.put("Y(K1=100,K2=200,K3=300)", 700.0);
    metrics.put("Y(K1=1000,K2=2000,K3=3000)", 800.0);

    //new MetricsLoader load all metrics data
    MetricsLoader loader = new MetricsLoader(metrics);

    //get name of 'X' Metrics then group by K1,K2
    MetricNode node = loader.getMetricTree("X","K1","K2");

    //get all Metrics of K1=1 and K2=20
    node.getChildrenNode("1").getChildrenNode("20").getMetrics();

    //get K3=30 Metric from node
    node.getChildrenNode("1").getChildrenNode("20").getFirstMatchMetricValue("K3","30");
More detail can be found in demo/perf/PerfMetricsFilePublisher.java
How to Extend Custom Metrics
Java Chassis Metrics support user extend custom metrics,MonitorManager had a set of method get different type of Monitor:
| Method Name | Description |
|---|---|
| getCounter | Get a counter monitor |
| getMaxGauge | Get a max monitor |
| getGauge | Get a gauge monitor |
| getTimer | Get a timer monitor |
Let us use Process Order make an example:
public class OrderController {
  private final Counter orderCount;
  private final Counter orderTps;
  private final Timer averageLatency;
  private final MaxGauge maxLatency;

  OrderController() {
    MonitorManager manager = MonitorManager.getInstance();
    //"product","levis jeans" and "model","512" are two custom Tag,support multi Tags
    this.orderCount = manager.getCounter("orderCount", "product", "levis jeans", "model", "512");
    this.orderTps = manager.getCounter(StepCounter::new, "orderGenerated", "statistic", "tps");
    this.averageLatency = manager.getTimer("orderGenerated", "statistic", "latency", "unit", "MILLISECONDS");
    this.maxLatency = manager.getMaxGauge("orderGenerated", "statistic", "max", "unit", "MILLISECONDS");
  }

  public void makeOrder() {
    long startTime = System.nanoTime();
    //process order logic
    //...
    //process finished
    long totalTime = System.nanoTime() - startTime;

    //increase order count
    this.orderCount.increment();

    //increase tps
    this.orderTps.increment();

    //record latency for average
    this.averageLatency.record(totalTime, TimeUnit.NANOSECONDS);

    //record max latency
    this.maxLatency.update(TimeUnit.NANOSECONDS.toMillis(totalTime));
  }
}
Notice:
1.Metric ID is join name and all tags that pass to MonitorManager when getting monitor,so please keep uniqueness,metrics output of front example are:
Map<String,Double> metrics = MonitorManager.getInstance().measure();

//metrics.keySet() include:
//	orderCount(product=levis jeans,model=512)
//	orderGenerated(statistic=tps)
//	orderGenerated(statistic=latency,unit=MILLISECONDS)
//	orderGenerated(statistic=max,unit=MILLISECONDS)
2.All get monitor method in MonitorManager act as get or new,so use same name and tags will return same one monitor:
Counter counter1 = MonitorManager.getInstance().getCounter("orderGenerated", "product", "levis jeans", "model", "512");
Counter counter2 = MonitorManager.getInstance().getCounter("orderGenerated", "product", "levis jeans", "model", "512");

counter1.increment();
counter2.increment();

Assert.assertEquals(2,counter1.getValue());
Assert.assertEquals(2,counter2.getValue());
Assert.assertEquals(2.0,MonitorManager.getInstance().measure().get("orderGenerated(product=levis jeans,model=512)"),0);
Performance of get monitor from MonitorManager is slightly lower,so please get all monitors what needed when init,then cache them for later use,like OrderController example.
Notice: Servo had marked with DEPRECATED by Netflix, we will use Netflix spectator instead in 1.0.0-m2, the way of extending custom metrics will be adjusted
Other Reference
We had developed two use case for reference:
- demo/perf:print Metrics in Console;
- metrics-prometheus:integration with prometheus,publish metrics as prometheus producer.