Metrics how integration with prometheus in 1.0.0-m1
Metrics had supported from Java chassis version 0.5.0,in version 1.0.0-m1,we had reconstruction it and add some more features,please checkout the user guide and release note for more information.Also subscribe ServiceComb mail-list(dev-subscribe@servicecomb.apache.org) and join discussion is welcome.
Background
Prometheus is a opensource open-source monitoring solution like Google Borgmon,also member of CNCF,community is very active.Java chassis metrics support integration with prometheus in 1.0.0-m1,and can use Grafana to query metrics data further.
Integration Principles
We known Java chassis developed by Java,so we use Simple Client in prometheus java client as SDK,the version we use is 0.1.0.
Prometheus use pull mode collect metrics data,microservice act as producer,we use Simple HTTP Server(also in client java SDK) publish them;
As an integration(optional) module,the implementation code is in metrics-integration/metrics-prometheus,you can get it’s dependency:
  <dependency>
    <groupId>io.prometheus</groupId>
    <artifactId>simpleclient</artifactId>
  </dependency>
  <dependency>
    <groupId>io.prometheus</groupId>
    <artifactId>simpleclient_httpserver</artifactId>
  </dependency>

  <dependency>
    <groupId>org.apache.servicecomb</groupId>
    <artifactId>metrics-core</artifactId>
  </dependency>
So if we import metrics-prometheus,no longer need to add metrics-core dependence.
How Configuration
Enable prometheus integration is very easy:
Global Configuration
Please add prometheus port config in microservice.yaml:
APPLICATION_ID: demo
service_description:
  name: demoService
  version: 0.0.1

servicecomb:
  metrics:
    prometheus:
      #prometheus provider port
      port: 9696
If do not config,default value is 9696
Maven Configuration
We just only need add metrics-prometheus dependency:
    <dependency>
      <groupId>org.apache.servicecomb</groupId>
      <artifactId>metrics-prometheus</artifactId>
      <version>1.0.0-m1</version>
    </dependency>
Config prometheus.yml in Prometheus
You need add job in prometheus.yml,like:
scrape_configs:
  # The job name is added as a label `job=<job_name>` to any timeseries scraped from this config.
  - job_name: 'prometheus'

    # metrics_path defaults to '/metrics'
    # scheme defaults to 'http'.

    static_configs:
      - targets: ['localhost:9090']

  - job_name: 'servicecomb'

    # metrics_path defaults to '/metrics'
    # scheme defaults to 'http'.

    static_configs:
      - targets: ['localhost:9696']
The job_name: ‘servicecomb’ is our custom job,it will collect metrics data from local microservice localhost:9696,more information about configuration of prometheus can found here.
Verify Output
Prometheus Simple HTTP Server use /metrics as default URL,metrics-prometheus will use 9696 as default port,after microservice start up you can get metrics data at http://localhost:9696/metrics.
Prometheus Simple HTTP Server provider interface will publish the standard format which prometheus needed:
# HELP ServiceComb Metrics ServiceComb Metrics
# TYPE ServiceComb Metrics untyped
jvm{name="cpuRunningThreads",statistic="gauge",} 45.0
jvm{name="heapMax",statistic="gauge",} 3.786407936E9
jvm{name="heapCommit",statistic="gauge",} 6.12892672E8
servicecomb_invocation_calculator_calculatorRestEndpoint_calculate{role="producer",stage="total",statistic="max",status="200",unit="MILLISECONDS",} 1.0
servicecomb_invocation_calculator_calculatorRestEndpoint_calculate{role="producer",stage="total",statistic="tps",status="200",} 0.4
jvm{name="nonHeapCommit",statistic="gauge",} 6.1104128E7
jvm{name="nonHeapInit",statistic="gauge",} 2555904.0
servicecomb_invocation_calculator_calculatorRestEndpoint_calculate{role="producer",stage="execution",statistic="max",status="200",unit="MILLISECONDS",} 0.0
jvm{name="heapUsed",statistic="gauge",} 2.82814088E8
servicecomb_invocation_calculator_calculatorRestEndpoint_calculate{role="producer",stage="total",statistic="latency",status="200",unit="MILLISECONDS",} 1.0
servicecomb_invocation_calculator_calculatorRestEndpoint_calculate{role="producer",stage="execution",statistic="latency",status="200",unit="MILLISECONDS",} 0.0
jvm{name="heapInit",statistic="gauge",} 2.66338304E8
servicecomb_invocation_calculator_calculatorRestEndpoint_calculate{role="producer",stage="queue",statistic="waitInQueue",} 0.0
servicecomb_invocation_calculator_calculatorRestEndpoint_calculate{role="producer",stage="total",statistic="count",status="200",} 39.0
jvm{name="nonHeapUsed",statistic="gauge",} 5.9361032E7
servicecomb_invocation_calculator_calculatorRestEndpoint_calculate{role="producer",stage="queue",statistic="latency",status="200",unit="MILLISECONDS",} 0.0
servicecomb_invocation_calculator_calculatorRestEndpoint_calculate{role="producer",stage="queue",statistic="max",status="200",unit="MILLISECONDS",} 0.0
Config Grafana(optional)
How add prometheus as a datasource in grafana can found here.
Effect Show
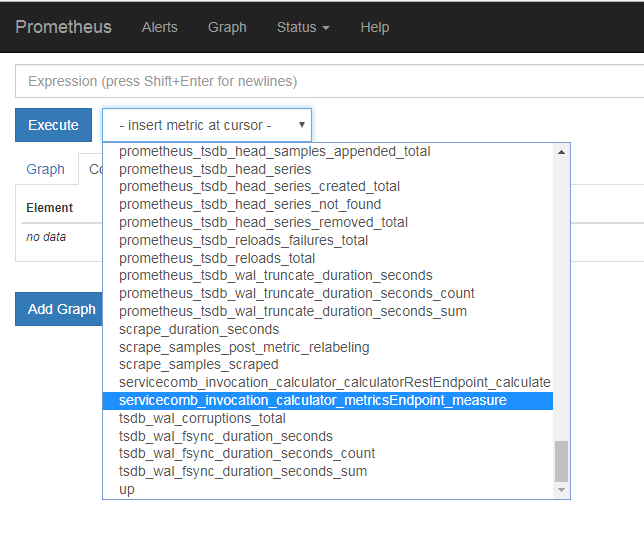
After complete prometheus config and start up microservice,we can open prometheus web site(default address is http://localhost:9090/),in metrics list java chassis metrics with prefix ‘servicecomb’ can be seen:

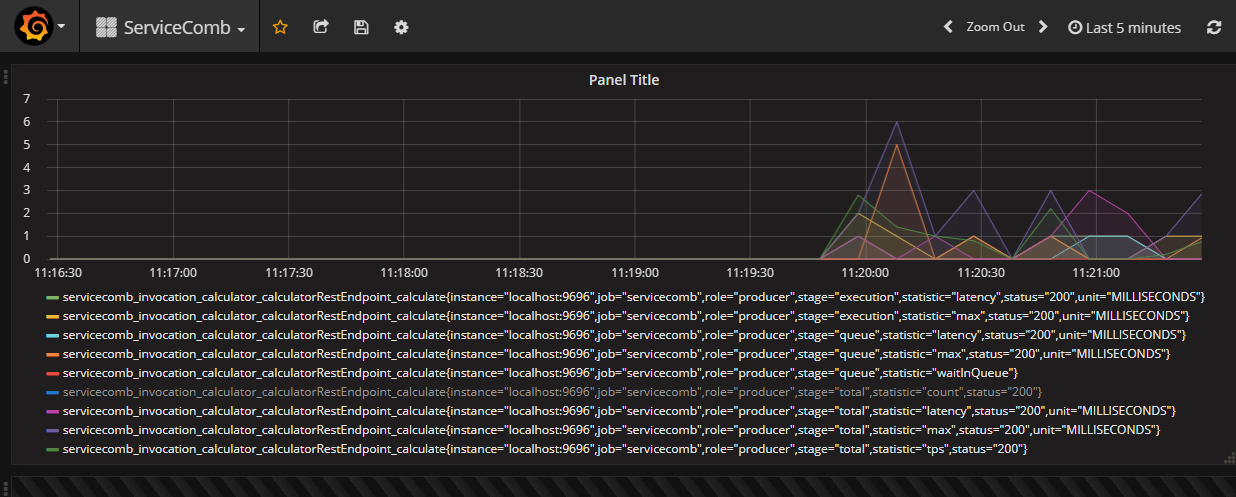
For get more better data query experience,add prometheus as a datasource in grafana then query metrics data by it:
